

Your ring says 38 this morning. Someone else's says 94. So what is heart rate variability? It is the variation in the time between consecutive heartbeats, measured in milliseconds [1]. It mostly reflects how one nerve, the vagus, is modulating your heartbeat. That is not the same as how strong its background tone is. The number barely travels between two people, and the device adds error: six wearables ran 4.7 to 33.1 ms from a simultaneous ECG [5]. Here is what the number is worth to you.
The short version
If you only read one part of this, read this one. Each line is unpacked further down, with its source.
- Heart rate variability measures the vagus nerve's moment to moment influence on your heartbeat, not how strong your heart is. RMSSD, the number most wearables report, is the measure most influenced by the parasympathetic side.
- The pooled short term norm in healthy adults is 42 ms for RMSSD, range 19 to 75. Those recordings varied in length, position and breathing. Nunan's authors report interindividual variation of up to 260,000 percent for some measures.
- Against a simultaneous ECG in a sleep laboratory, consumer devices were off by 4.7 to 33.1 ms of RMSSD. For rough scale, and across different recording types, that top error is close to the whole short term clinical norm.
- Low HRV is associated with worse outcomes. The lowest SDNN group was associated with a relative risk of 1.35 (1.10 to 1.67) for a first cardiovascular event. The lowest RMSSD quartile carried a hazard ratio of 1.56 (1.32 to 1.85) for death from any cause. Both are associations in clinical recordings, not in wearable readings.
- Your breathing rate alone can move the number without any change in vagal tone. That is why measurement conditions matter more than most people think.
What heart rate variability actually measures: the nerve, not the heart
Your heart is not a metronome. Between one beat and the next, the gap changes by a few milliseconds every time, and heart rate variability is the size of that change [1]. A review of the metrics puts it plainly: HRV consists of changes in the time intervals between consecutive heartbeats, and a healthy heart is not a metronome.
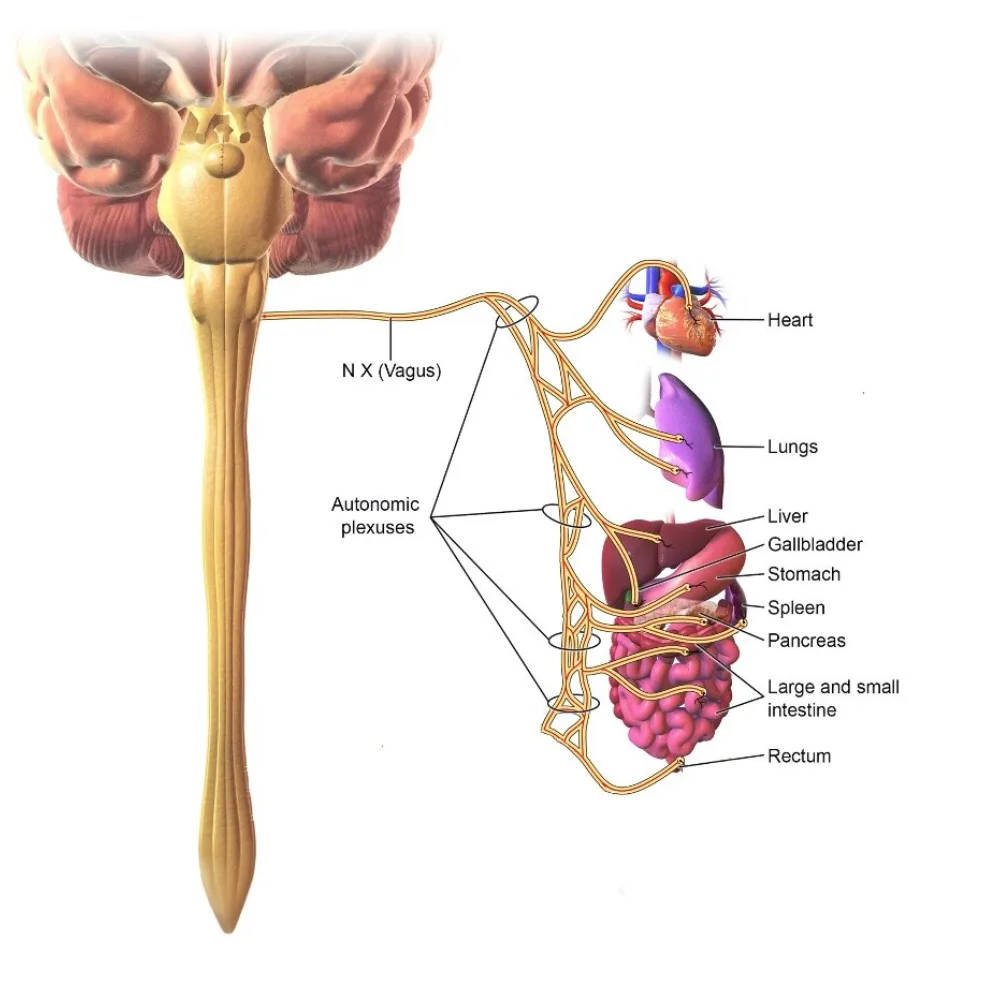
What moves those gaps is mostly one nerve. The vagus nerve runs from your brainstem to your heart and acts as a brake. When it lets go a little, the next beat comes sooner. When it tightens, the next beat comes later. The number on your wrist is a reading of that brake, not of how strong your heart muscle is.
You can feel it working. Heart rate speeds up as you breathe in and slows down as you breathe out [1]. On the inhale your brain briefly inhibits vagal outflow, so the heart runs free. On the exhale your brain restores that outflow, and the heart slows. That rhythm has a name, respiratory sinus arrhythmia, and it is most of what your overnight number is made of.
This is why I never let a client read HRV as a fitness score. It is a nervous system reading. A high number says the brake is being applied generously tonight. A low number says it is not. Both can be true of a very fit person, in the same week, for reasons that have nothing to do with their heart.
| Client | Where his own wearable started him | Where he got to |
|---|---|---|
| Jeff K. | 12, a monthly average | 19, with new daily highs in the 27 to 29 range |
| Steven S. | 44, in February | Several of his highest scores ever, in the 50s |
| Kirk P. | A 130 to 140 baseline | 154, a record high |
Why is my heart rate variability so low?
Often because you are comparing yourself to someone whose number was never comparable. HRV depends on your age, your sex, your genetics, the device, the measure it reports and the length of the recording. Change any one of those and the number changes, with no change in you at all.
The spread between healthy people is enormous. The standard systematic review of short term values pooled 44 studies and 21,438 healthy adults [2]. Its authors report interindividual variation of up to 260,000 percent, particularly for the frequency measures. That is not a typo. Two healthy people can sit orders of magnitude apart.
Age pulls the number down, and not in a straight line. In a 2017 review's account of 1,743 people aged 40 to 100, SDNN fell linearly with age [1]. RMSSD and pNN50 followed a U shape instead: down from 40 to 60, then back up after 70. So a man of 58 comparing himself to his own reading at 43 is seeing something real, and something that does not continue forever.
Sex matters, but only for some measures. That same 2017 review reports a meta-analysis of 296,247 healthy participants [1]. Women had a higher mean heart rate and lower SDNN, with greater high frequency power. In 8.2 million wearable users, SDRR and low frequency power varied with sex while RMSSD and high frequency power did not [7]. That study was funded by Fitbit and written largely by its own researchers, so read the direction and not the numbers.
So the honest answer to why your number is low is often that it is not low. It is yours. The published figures are useful for scale, as you will see further down. But the only baseline you can read a trend against is the one you built yourself, on one device, under conditions you did not change.
Is a low HRV a problem, or just a low number?
A low heart rate variability can be both, and the evidence is better than most people assume. One meta-analysis pooled eight prospective studies and 21,988 people with no known cardiovascular disease [3]. In those clinical recordings the lowest SDNN group was associated with a 35 percent higher relative risk of a first cardiovascular event than the highest. For low frequency power the associated figure was 45 percent.
A larger and more recent analysis found the same shape for death from any cause. It covered 32 studies and two individual participant datasets, 38,008 people in all [4]. Being in the lowest quartile of five minute clinical RMSSD was associated with a hazard ratio of 1.56 for death from any cause, against the other quartiles. The authors report the direction held across ages, sexes, continents and populations. The 1.56 estimate itself comes from five minute recordings.
Now the part the wearable industry skips. Every one of those numbers comes from a clinical ECG, not from a ring's overnight estimate, and the recordings behind them are a jumble of lengths. Hillebrand's eight studies ran from ten seconds to twenty four hours [3]. None of them is what your ring does. The comparison in both is a band drawn inside each study's own sample, not a millisecond threshold you can check against your own screen. And all of it is observational.
That last word carries more weight than it looks. Hillebrand's team reported that a one percent higher SDNN was associated with about one percent lower risk [3]. That is a meta-regression prediction drawn from where people already sat. It is not a demonstration that raising your HRV lowers your risk, and nobody has shown that it does.
One more honest line from the same analysis: the high frequency result was 1.32 with a confidence interval of 0.96 to 1.81 [3]. That interval crosses 1, so that particular association was not statistically significant. A good source tells you which of its findings held and which did not.
So the reading I give a client is this. A single low morning is noise. A baseline that has been drifting down for a month, with sleep and training unchanged, is a reason to look harder at what else has changed. It is not a diagnosis, and it never replaces a conversation with your physician.
What is a normal HRV by age, and why do the charts disagree?
There is no percentile table I would put my name to, and the reason matters. The best pooled figures come from short term ECG recordings in healthy adults [2]. SDNN averaged 50 ms, with a published range of 32 to 93. RMSSD averaged 42 ms, range 19 to 75. Those are pooled clinical values of varied recording length, body position and breathing, read here from the table reproduced with permission in Shaffer and Ginsberg's review [1]. The pool also leans older. Three of its largest populations had a minimum age of 40, which Shaffer says may be why the values sit low.
Those pooled values are not what your ring reports. Recording length changes the result on its own. Longer recordings carry more variability, so 24 hour, five minute and ultra short values are not interchangeable, and comparing them is inappropriate [1]. Your overnight number and a clinic's five minute strip are different measurements of different things.
The risk bands people quote online make this worse. The familiar thresholds of under 50 ms unhealthy, 50 to 100 compromised and over 100 healthy are for SDNN over a full 24 hours in cardiac patients [1]. Laying them over a ring's overnight RMSSD is a category error. If your ring says 42, those bands have told you nothing.
Age does pull the number down, and the parasympathetic side falls faster. One 2020 study measured 8.2 million wearable users in the same early morning hour [7]. Between the ages of 20 and 60, low frequency power fell about 66.5 percent in men and 69.3 percent in women. High frequency power fell about 82.0 and 80.9 percent. That study was funded by Fitbit and written largely by its own researchers, so take the direction and not the precision.
The charts in app stores disagree because each one is built from its own users, on its own hardware, with its own algorithm. Nunan's authors were blunt about the state of the field [2]. Methodological discrepancies underlie the disparate values. What is needed is large scale population studies and a review of the standards. Sixteen years later, that is still true.
If you want a usable answer anyway, here it is. Take your own fourteen night median on one device, under the same conditions. That is your normal. Everything else is someone else's.
Which HRV number is your watch actually showing you?
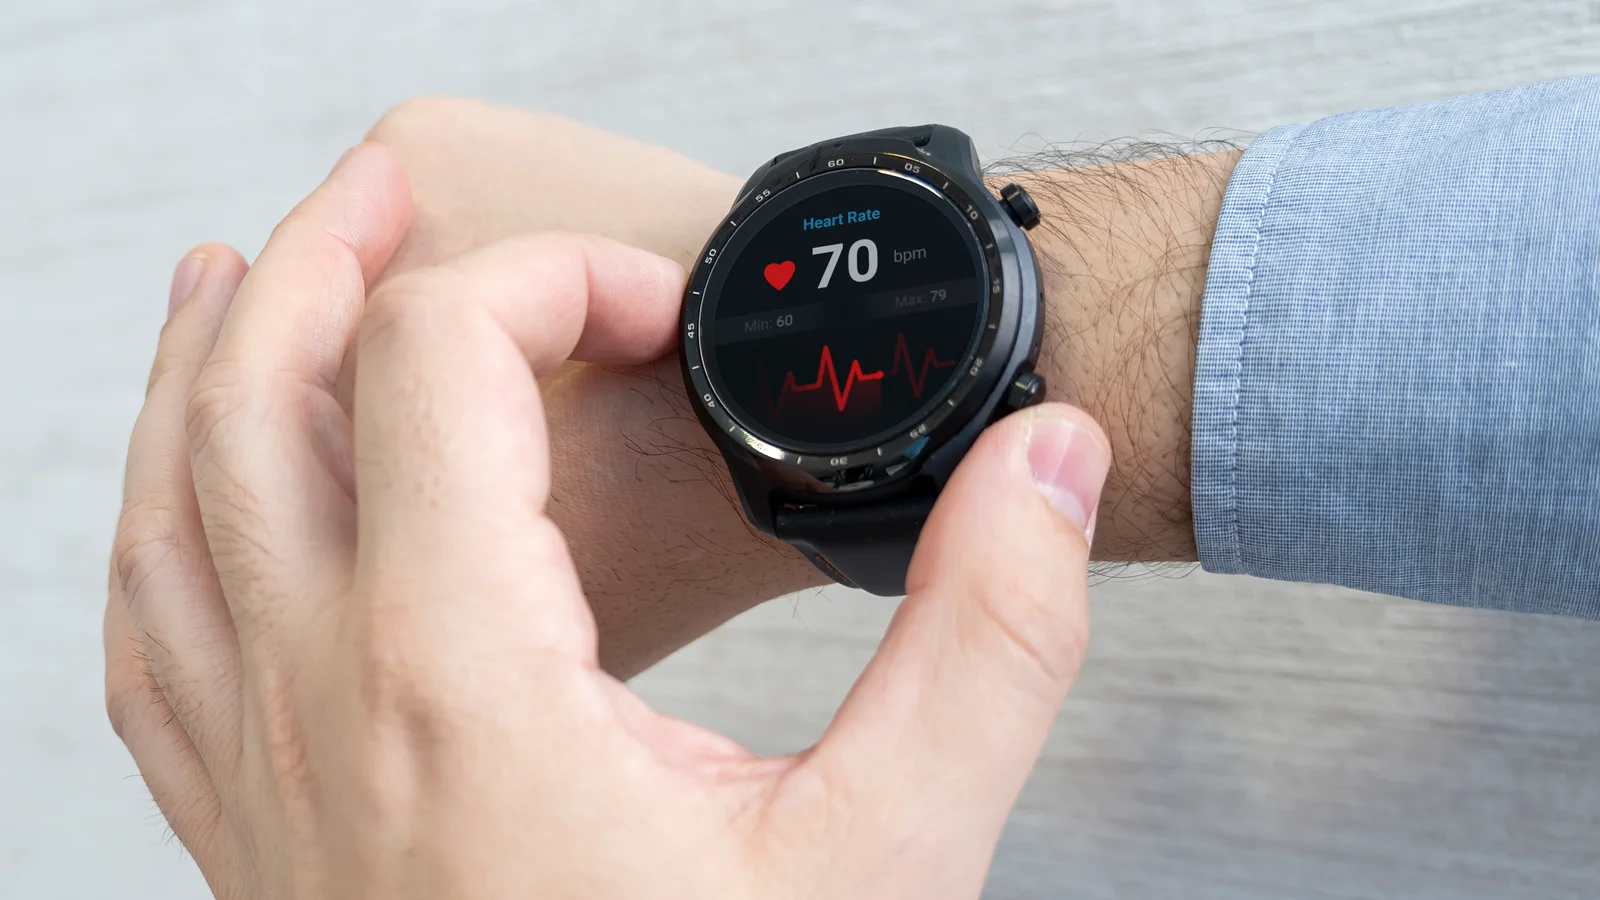
Usually RMSSD, the root mean square of successive differences, which is the time domain measure most influenced by the parasympathetic side [1]. Usually, not always. One independent test complains that consumer devices simply display a value called HRV without saying which measure it is, leaving the end user to find out [6]. Check your own device's documentation before you compare anything. That is a reasonable choice. It is also the measure most sensitive to how long you recorded for and how you were breathing.
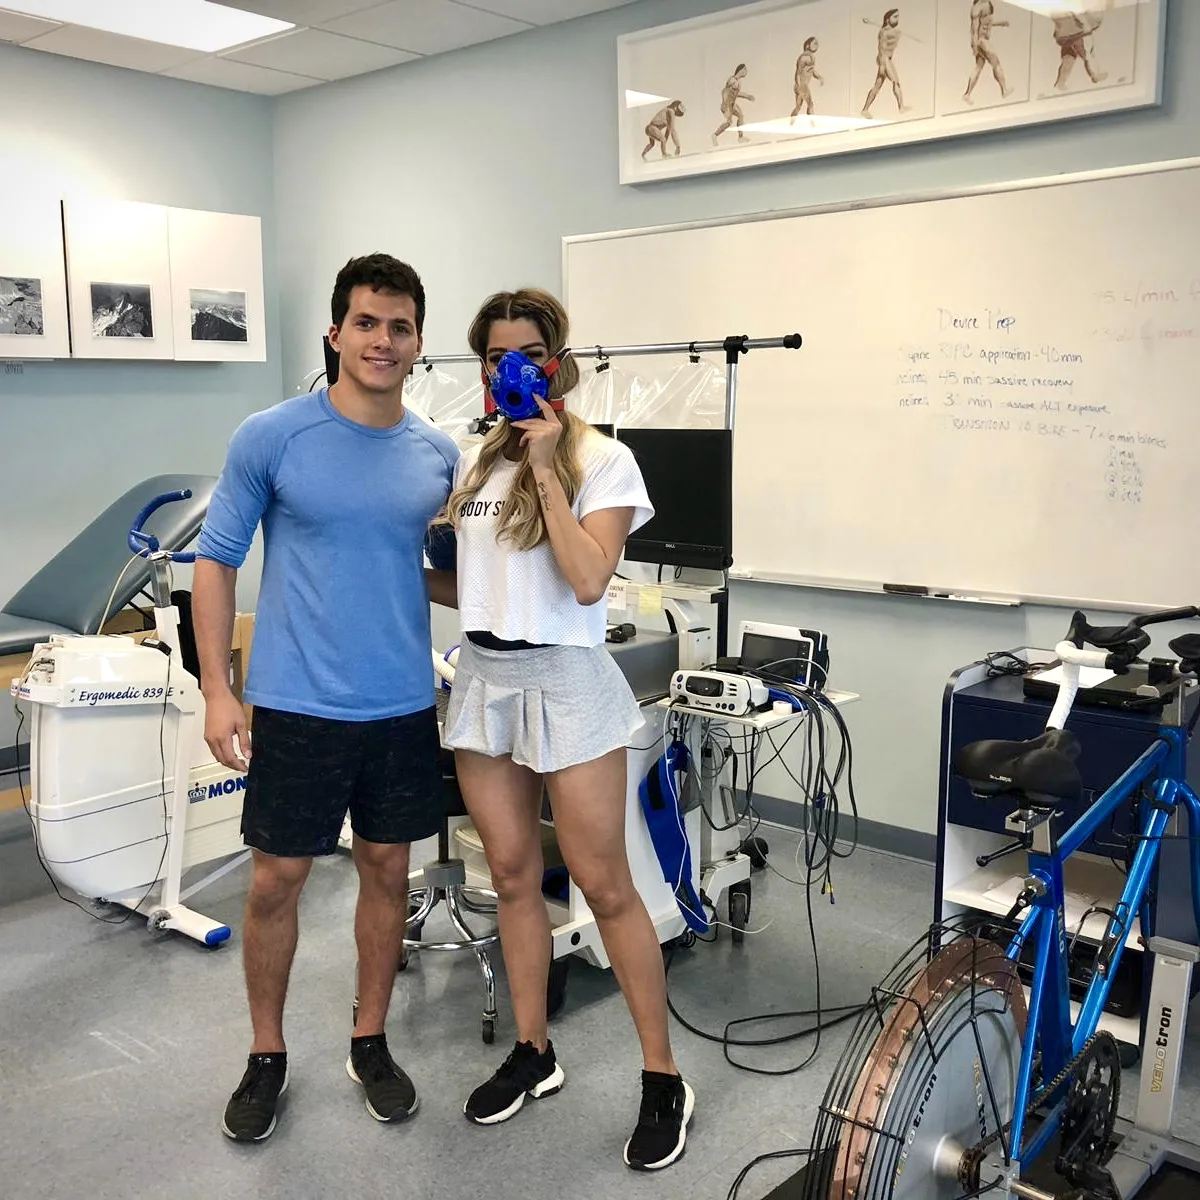
How close does a wearable get? The closest thing to a head to head test put six devices on 53 adults for one night each, in a sleep laboratory, against a simultaneous electrocardiogram [5]. The absolute errors in RMSSD ran from 4.7 ms to 33.1 ms. For rough scale, the pooled short term norm for RMSSD in healthy adults is 42 ms [2]. An error over 20 ms is therefore on the order of half a normal reading. That is a yardstick across two different protocols and two different populations, not a matched comparison.
The errors were not evenly spread either. The Apple Watch overestimated HRV when the true value was low, and underestimated it when the true value was high [5]. At the highest true values its limits of agreement ran from minus 123.6 to 28.4 ms. The Garmin's correlation with ECG was 0.24, which that paper's own scale calls poor.
It is worth knowing who paid. That study was funded by the Australian Institute of Sport, and the authors' laboratory receives funding and equipment from WHOOP, the device that performed best [5]. The authors declare it themselves. The devices were 2018 to 2021 models, so treat the ranking as dated rather than permanent. The authors also state that WHOOP was not involved in the design, conduct or reporting of the study.
An independent laboratory with no device funding found the same kind of scatter on a different measure. Across 148 trials in five healthy young adults, mean absolute percentage error ranged from 4 to 112 percent, and a phone camera app was the worst performer [6]. Five people is a very small study, and the authors are clear about it. Their structural finding is that recording length mattered more than sensor type. The two technologies that sampled for only three minutes did worse on RMSSD than everything that sampled for five. Within a single app, chest ECG did beat optical sensing. But a finger ring and a chest strap both broke that pattern, and the authors say duration had the greater impact.
Reviewers surveying this literature for a military application reached the practical version of the same point [11]. Writing in 2021, they said the Polar H10 chest strap appears to be the most accurate of the devices they reviewed against criterion measures. They also noted that many consumer devices only sample at rest or during sleep, and few can record continuously.
What actually moves heart rate variability?
Start with the uncomfortable one. Your breathing rate alone changes the number. Shifts in respiration rate and volume can markedly change HF power, RSA, pNN50 and RMSSD without actually affecting vagal tone [1]. So a night when you happened to breathe more slowly can produce a better reading with nothing better going on inside you.
That cuts both ways, and it is the most useful thing in this article. Most of what is sold as how to improve heart rate variability is really how to improve a single reading. Slow breathing, under ten breaths a minute, does raise HRV and respiratory sinus arrhythmia while you are doing it [8]. The systematic review behind that found only 15 usable studies out of 2,461 abstracts screened. It reports directions rather than effect sizes. Its acknowledgment names a yoga and natural therapies association as its only supporter. Its funding statement lists an EU regional fund, an Italian National Research Council project and a University of Pisa ERC grant. Either way the interest is on the page, declared.
Read it as a real acute effect with thin and interested evidence behind it, not as a way to move tomorrow's baseline. Slow breathing and the parasympathetic response is the practical companion to this section.
Alcohol is associated with a lower overnight number, and the association tracks the dose. In 2018, 4,098 Finnish employees had their drinking nights compared against their own alcohol free nights [9]. Intake was dose dependently associated with more sympathetic and less parasympathetic regulation during the first hours of sleep. Two of that paper's authors work for Firstbeat, the company whose sensor produced the data, so read the direction rather than the size. The association was similar in the active and the sedentary, and similar in the young and the older. Fitness did not show up in this dataset as a buffer.
Training moves it less predictably than the apps suggest. A meta-analysis of endurance training studies found resting RMSSD rose when performance improved, which is the story everyone expects [10]. It also rose slightly when athletes were overreached and performing worse. The authors' conclusion is that resting HRV is largely unaffected by overreaching, although they add that this may be a methodological issue rather than a physiological one. Either way it makes a single morning dip a poor diagnosis of anything.
And daily movement tracks with better numbers at population scale. Across 8.2 million users in 2020, increased daily physical activity correlated with improvement in diverse HRV measures in a dose dependent manner [7]. The authors call it correlation and say prospective trials are needed. That study was funded by Fitbit, so I give it the weight a manufacturer's own data deserves.
This post deliberately stops here on training, sleep and alcohol as levers, because they belong to a different question. If what you actually want is a lower resting heart rate, read how to lower your resting heart rate, which covers the training evidence properly.
How I read a client's HRV trend
The same way every week, and never as a single number. With Jeff, we sat down every week with his HRV, his resting heart rate, his weight and his sleep together. That turned an invisible nervous system into something we could actually move. His monthly average went from 12 to 19 over the period. New daily highs in the 27 to 29 range showed up alongside an 8 percent drop in resting heart rate, in a single month. In his own words on that page: "I'm following exactly what you've told me to do. And it works great."
With Steven, the shape of the climb mattered more than any one reading. He started at 44 in February, improved in March, again in April and again the month after. That was roughly 5 percent month over month, with several of his highest scores ever landing in the 50s. That is not a lucky spike. That is a trend you can trust because it repeated.
Kirk started from a baseline already among the strongest I had seen, 130 to 140. He still climbed to a record 154, alongside his best average sleep score. Three men, three scales that share nothing, and the same method underneath.
So the rule is four lines long. Read your own trend, not a chart. Read fourteen nights, not one. Change one thing at a time and keep the conditions identical. And when a number moves, look for the reason in your week before you look for it in your physiology.
That last line is where most people go wrong. It is completely bio-individual, and it is not a cookie cutter approach. Two clients with the same drop will have two different reasons, and neither of them is on the app's dashboard.
Each of these is one person, published in full: Jeff K., Steven S. and Kirk P.. What a case study is not is a trial. There is no control group and no blinding, and in each case the subject was a motivated man working weekly with a coach. The literature above carries the mechanism; these three show one application of it. The results presented reflect one individual's outcome and should not be interpreted as typical.
Your HRV this week: what to measure and what to ignore
Here is the protocol I would give you if you were on a call with me. It is designed to make your own number mean something, which no amount of comparing will.
Pick one device and keep it. Switching between a ring and a watch restarts your baseline from zero, because you are changing the sensor, the algorithm and the recording window at the same time. If accuracy matters more to you than convenience, a 2021 review put a chest strap ahead of the wrist devices it looked at [11]. Independent testing points the same way for a different reason [6]. The devices in that test that sampled for only three minutes were its worst performers on RMSSD. Its best were the five minute recordings, and one of them was a finger ring.
Measure at the same time, in the same position, and give it at least five minutes if you are taking a morning reading. That independent laboratory recommends device makers record for five minutes or more [6]. That is the point: the window matters as much as the hardware. If your device reads overnight instead, let it, and do not mix the two.
Collect fourteen nights before you conclude anything, and work with the median rather than the best or worst night. Then hold your measurement conditions still: same time, same position, same device, same recording length. If you want the training evidence behind a resting number, that is the resting heart rate piece. What moves HRV over weeks is a question this article deliberately leaves open.
Ignore the comparison charts, the readiness score you did not define, and any single morning. Ignore the 24 hour clinical risk bands entirely unless someone has actually put a 24 hour ECG on you. And remember you are reading a nervous system, which is allowed to have a bad night for a reason as ordinary as a late meal.
For the longer conversation, the episode on what a wearable can and cannot measure covers the hardware, and the HRV episode with Dr. Jay Wiles is where this site started on the subject. One thing this article cannot answer is whether HRV biofeedback trains the number upward over time, because I could not reach a trustworthy effect size for it. Dr. Wiles is board certified in exactly that, so his episode is the better place to take the question.
- One device, kept. Switching restarts your baseline.
- The same time and the same position, every reading.
- Five minutes or more for a spot check, if your device takes one.
- Fourteen nights before you draw any line at all.
- One variable changed at a time, and your measurement conditions held still.
- Your own median as your only benchmark.
- And it is completely bio-individual, so what moves your number may not move anyone else's. This article is education, not medical advice. If your own trend worries you, take it to your physician rather than to a forum.
Quick answers
What is a good heart rate variability for my age?
There is no trustworthy percentile table, and that is an honest answer rather than a dodge. The best pooled figures are short term ECG values in healthy adults, of mixed recording length [2]. SDNN averaged 50 ms, range 32 to 93. RMSSD averaged 42 ms, range 19 to 75. Those are clinical recordings, not what a ring reports overnight, and the same review found interindividual variation of up to 260,000 percent for some measures. Age does pull the number down, although RMSSD follows a U shape rather than a straight line, falling from 40 to 60 and rising again after 70 [1]. Your own fourteen night median on one device is the only benchmark worth using.
Why is my HRV lower than my friend's?
Because the two numbers were probably never comparable. Different devices, different algorithms, different recording windows and different measures all produce different values from the same physiology. Three of our own clients started at 12, at 44 and at a 130 to 140 baseline, each on his own wearable, and all three were improving. Each of those is one client's own published result, not a typical outcome. HRV also varies hugely between healthy people in the published literature [2]. Comparing absolute HRV numbers between two people tells you almost nothing about either.
Does a low HRV mean I am stressed, or is it dangerous?
Not on its own, and not from one night. HRV falls when the vagal brake eases off. A hard week can do that, and so can a late meal, a short night or a coming illness. One reading cannot separate stress from any of them. Low HRV is associated in large studies with worse outcomes [4]. One example: a hazard ratio of 1.56 for the lowest quartile of five minute RMSSD against the other quartiles. That came from a sub-analysis of the studies reporting it, inside a review covering 38,008 people in all. But those are clinical recordings and population associations, and the band is drawn inside each study's own sample rather than being a threshold you can check. A single low morning is noise. A baseline drifting down over a month, with sleep and training unchanged, is worth investigating with your physician.
What is RMSSD, and is it the same as HRV?
RMSSD is one way of measuring HRV, and it is the one most wearables report. It is the root mean square of successive differences between normal heartbeats, and it is the time domain measure most influenced by the parasympathetic nervous system [1]. SDNN is a different measure, the standard deviation of all the normal intervals, and the 24 hour version is what clinicians use for cardiac risk stratification. They are not interchangeable, and neither is comparable across different recording lengths.
Can breathing exercises raise HRV?
While you are doing them, yes. A systematic review of slow breathing under ten breaths a minute found it increases HRV and respiratory sinus arrhythmia [8]. Two caveats belong with that. Only 15 studies out of 2,461 screened abstracts met the criteria. Its acknowledgment credits a yoga and natural therapies association as its sole supporter, while its funding statement also lists public and EU grants. More importantly, changing your breathing rate moves HRV indices without necessarily changing vagal tone. An improved reading during a breathing session is not the same as an improved baseline tomorrow [1].
Why does my HRV change so much night to night?
Because it is a nervous system reading, and your nervous system has nights. Alcohol is the mover with the clearest dose response in the literature I would cite. In 4,098 people compared against their own alcohol free nights, intake was dose dependently associated with reduced parasympathetic regulation during the first hours of sleep [9]. Two of that study's authors work for the company whose sensor collected the data. The association was similar in the active and the sedentary. Breathing rate alone also moves the number [1]. Night to night swings are expected. That is exactly why fourteen nights and a median beat any single reading.
Is HRV from a watch as good as a chest strap?
No, although the gap depends on the device. Against a simultaneous ECG, six consumer devices were off by 4.7 to 33.1 ms of RMSSD [5]. That study's laboratory receives funding and equipment from the maker of the device that came out best, which the authors declare. Independent testing of seven devices and apps, in five healthy young adults, found mean absolute percentage errors from 4 to 112 percent [6]. It concluded that the duration of the recording mattered more than the type of sensor. The two technologies that sampled for only three minutes were its weakest on RMSSD. A 2021 narrative review, funded by the UK Ministry of Defence, looked at the field [11]. It said the Polar H10 chest strap appeared to be the most accurate of the devices it compared against criterion measures. That verdict is five years old and covers only what that review looked at.
You can also have your own numbers read against your own baseline, by someone who knows what the sensor can and cannot see. That is what a call with me is for. Discover your science, then optimize your life.
Supporting Evidence
- Shaffer, F., & Ginsberg, J. P. (2017). An Overview of Heart Rate Variability Metrics and Norms. Frontiers in Public Health, 5, 258. Conflict of interest: the authors declare the research was conducted in the absence of any commercial or financial relationships. Note: both authors also publish in the HRV biofeedback field. Narrative review. Read 30 September 2026. doi:10.3389/fpubh.2017.00258
- Nunan, D., Sandercock, G. R. H., & Brodie, D. A. (2010). A quantitative systematic review of normal values for short-term heart rate variability in healthy adults. Pacing and Clinical Electrophysiology, 33(11), 1407-1417. 44 studies, 21,438 participants. The SDNN and RMSSD values quoted here were read from Shaffer and Ginsberg 2017, Table 6. That table reproduces Nunan's with permission of John Wiley and Sons; the Wiley page itself was not fetched. Funding not read. Read 30 September 2026. doi:10.1111/j.1540-8159.2010.02841.x
- Hillebrand, S., Gast, K. B., de Mutsert, R., Swenne, C. A., Jukema, J. W., Middeldorp, S., Rosendaal, F. R., & Dekkers, O. M. (2013). Heart rate variability and first cardiovascular event in populations without known cardiovascular disease: meta-analysis and dose-response meta-regression. Europace, 15(5), 742-749. 8 studies, 21,988 participants. HRV recordings in the included studies ran from 10 seconds to 24 hours. No funding section; "Conflict of interest: none declared." Read 30 September 2026, Table 1 and the full Methods and Results read 1 October 2026. doi:10.1093/europace/eus341
- Jarczok, M. N., Weimer, K., Braun, C., Williams, D. P., Thayer, J. F., Gundel, H. O., & Balint, E. M. (2022). Heart rate variability in the prediction of mortality: A systematic review and meta-analysis of healthy and patient populations. Neuroscience and Biobehavioral Reviews, 143, 104907. 32 studies and two individual participant datasets, 38,008 participants. Full text not reachable (the publisher returned 403), so the paper's own funding and competing-interest statements were not read. The PubMed grant index lists awards from NHLBI, the NIA, the British Heart Foundation and the UK Medical Research Council. Those appear to attach to the contributing cohorts rather than to this analysis. Abstract only. Read 30 September 2026. doi:10.1016/j.neubiorev.2022.104907
- Miller, D. J., Sargent, C., & Roach, G. D. (2022). A Validation of Six Wearable Devices for Estimating Sleep, Heart Rate and Heart Rate Variability in Healthy Adults. Sensors, 22(16), 6317. 53 adults, one night each. Funded by the Australian Institute of Sport. The authors' research group receives funding and equipment from WHOOP Inc., whose device performed best. The authors state WHOOP was not involved in the study's design, conduct or reporting. Read 30 September 2026. doi:10.3390/s22166317
- Stone, J. D., Ulman, H. K., Tran, K., Thompson, A. G., Halter, M. D., Ramadan, J. H., Stephenson, M., Finomore, V. S., Galster, S. M., Rezai, A. R., & Hagen, J. A. (2021). Assessing the Accuracy of Popular Commercial Technologies That Measure Resting Heart Rate and Heart Rate Variability. Frontiers in Sports and Active Living, 3, 585870. Five healthy young adults, 148 trials. No external funding; funded internally by the Rockefeller Neuroscience Institute at West Virginia University; no commercial or financial relationships declared. Read 30 September 2026. doi:10.3389/fspor.2021.585870
- Natarajan, A., Pantelopoulos, A., Emir-Farinas, H., & Natarajan, P. (2020). Heart rate variability with photoplethysmography in 8 million individuals: a cross-sectional study. The Lancet Digital Health, 2(12), e650-e657. Funding: Fitbit. Three of the four authors worked for the device maker whose data this is. Directional findings only are used here; the benchmark tables were not read. Read 30 September 2026. doi:10.1016/S2589-7500(20)30246-6
- Zaccaro, A., Piarulli, A., Laurino, M., Garbella, E., Menicucci, D., Neri, B., & Gemignani, A. (2018). How Breath-Control Can Change Your Life: A Systematic Review on Psycho-Physiological Correlates of Slow Breathing. Frontiers in Human Neuroscience, 12, 353. 15 of 2,461 screened abstracts met the criteria. The acknowledgment credits the Associazione Yoga e Terapie Naturali as its sole supporter. The separate funding statement additionally names the LAID-Smart Bed Project, POR CREO FESR 2014-2020, a National Research Council flagship project and a University of Pisa ERC grant. The authors declare no commercial or financial conflict. Read 30 September 2026. doi:10.3389/fnhum.2018.00353
- Pietila, J., Helander, E., Korhonen, I., Myllymaki, T., Kujala, U. M., & Lindholm, H. (2018). Acute Effect of Alcohol Intake on Cardiovascular Autonomic Regulation During the First Hours of Sleep in a Large Real-World Sample of Finnish Employees. JMIR Mental Health, 5(1), e23. 4,098 participants, within-subject. Funded by the Finnish Funding Agency for Technology and Innovation; two authors are employed by Firstbeat Technologies, whose technology produced the data, and one by Nokia Technologies. Read 30 September 2026. doi:10.2196/mental.9519
- Bellenger, C. R., Fuller, J. T., Thomson, R. L., Davison, K., Robertson, E. Y., & Buckley, J. D. (2016). Monitoring Athletic Training Status Through Autonomic Heart Rate Regulation: A Systematic Review and Meta-Analysis. Sports Medicine, 46(10), 1461-1486. 27 studies reviewed, 24 in the meta-analysis, endurance-trained athletes. Abstract only; funding not readable. Read 30 September 2026. doi:10.1007/s40279-016-0484-2
- Hinde, K., White, G., & Armstrong, N. (2021). Wearable Devices Suitable for Monitoring Twenty Four Hour Heart Rate Variability in Military Populations. Sensors, 21(4), 1061. Narrative review; device verdicts date from 2021. Funded by the UK Ministry of Defence; the authors declare no conflict of interest. No device maker funded it. Read 30 September 2026. doi:10.3390/s21041061