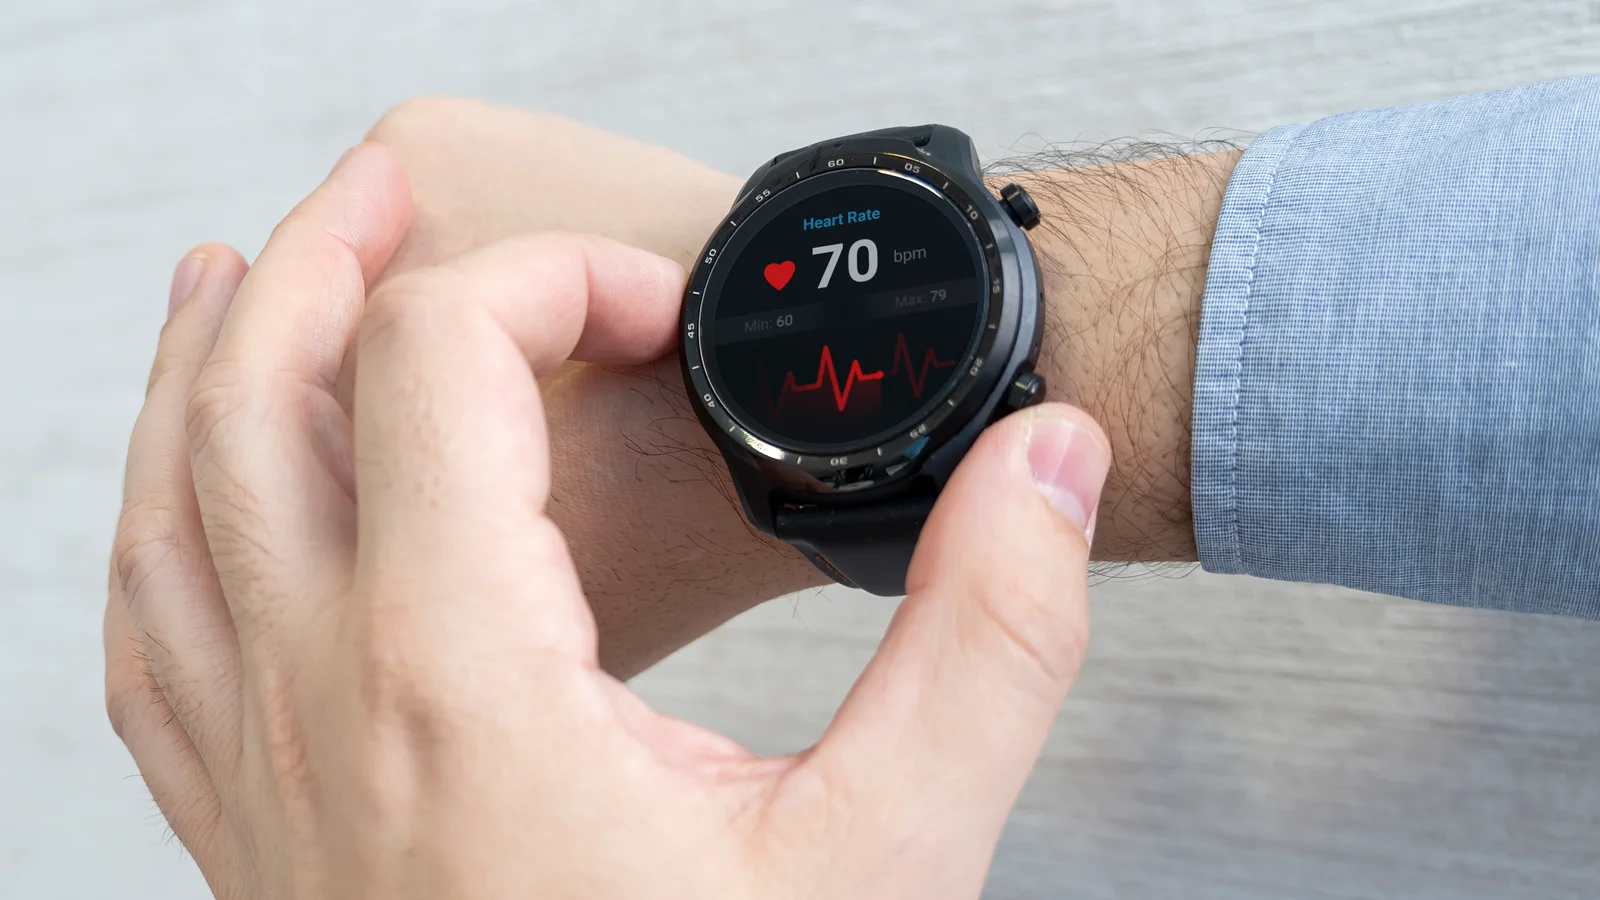

Your watch says your VO2 max is 38. Is that good? For a man of 30, it's below the middle of his age group. For a man of 55, it's above the middle and close to the top quarter. For a woman of 45, it's near the top 10 percent. The number means nothing until you place it against your age and sex. Below is VO2 max by age, measured: percentiles for men and women from 7,783 lab tests, twenties to seventies, with the caveats most charts leave out.
What is a good VO2 max by age? The measured percentiles
Above the median for your sex and decade is good, and the 75th percentile is the top quarter. I read that off the FRIEND registry: 7,783 maximal treadmill tests in US adults aged 20 to 79 without cardiovascular disease [1]. The men's median runs 48.0, 42.4, 37.8, 32.6, 28.2 and 24.4 ml/kg/min from the twenties to the seventies. The women's runs 37.6, 30.2, 26.7, 23.4, 20.0 and 18.3 over the same decades [1]. Both full tables are below, then the caveats.
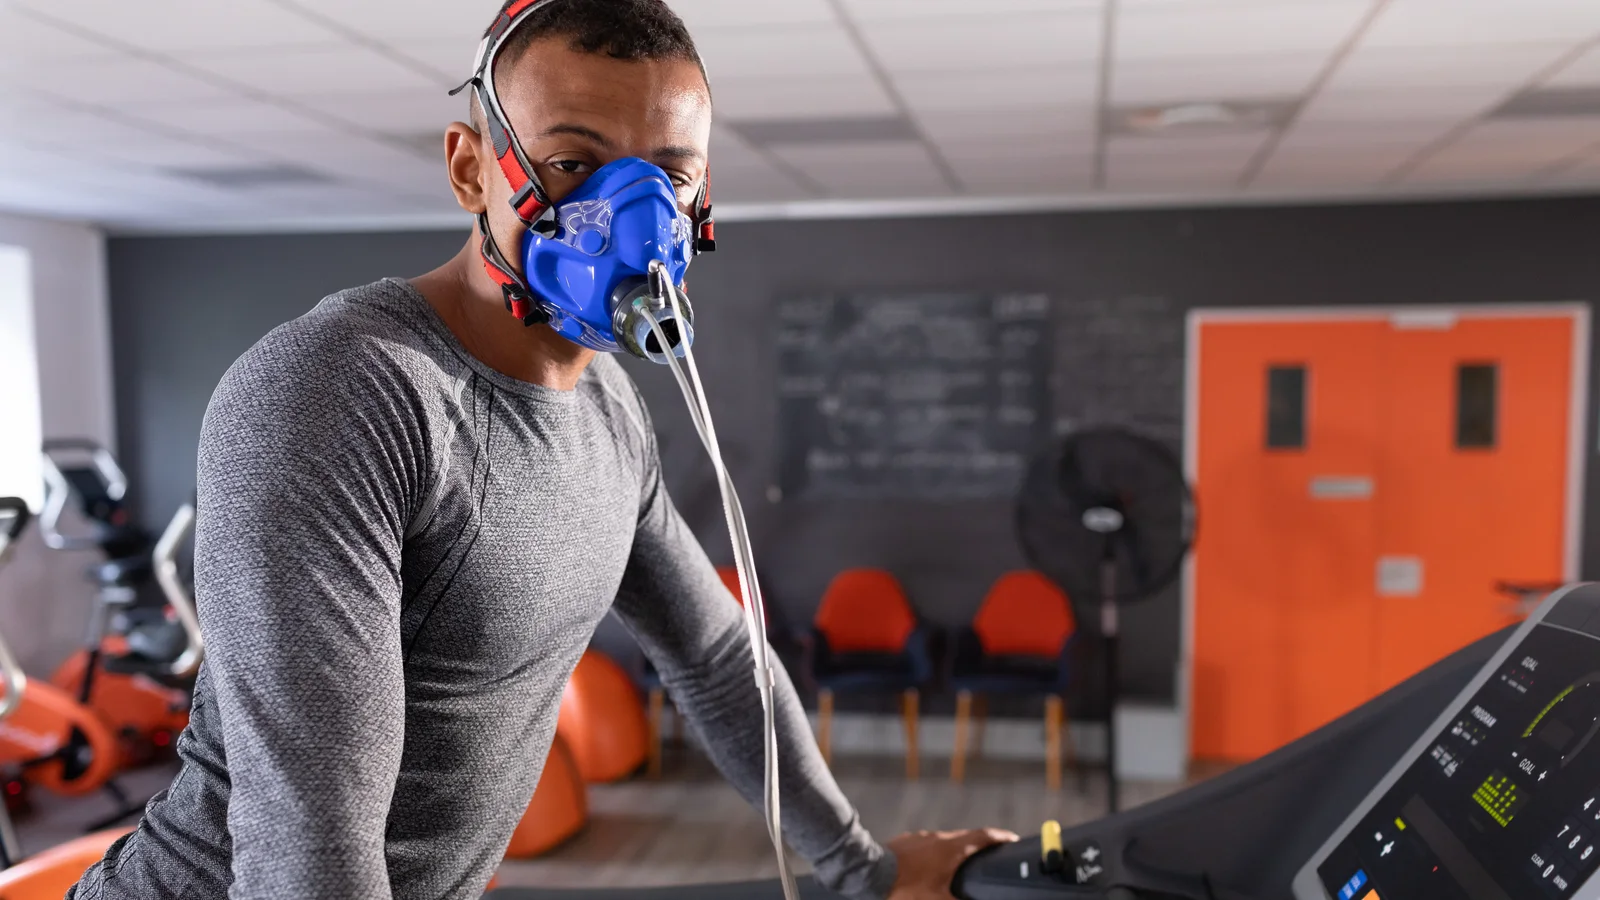
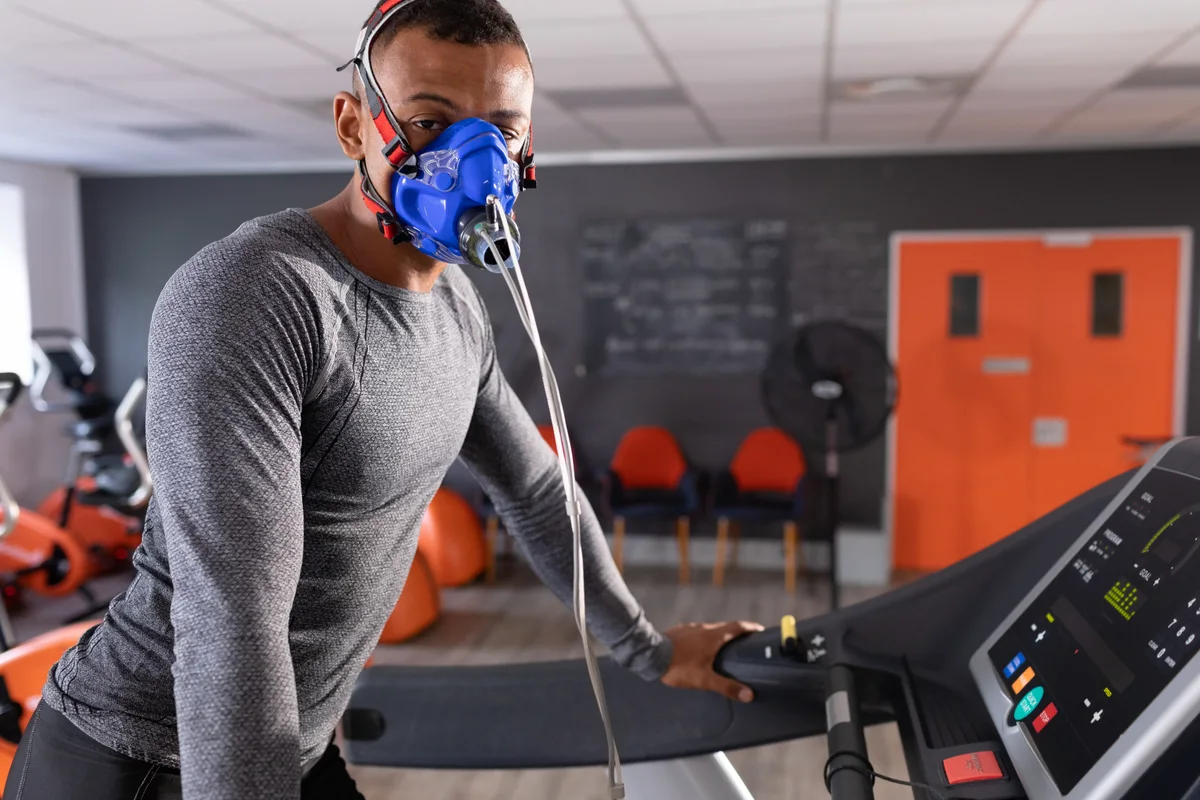
The VO2 max charts I see online come from one of two places. A device maker's manual, or the older Cooper Clinic tables, which estimated fitness from treadmill speed and grade rather than measuring oxygen [1]. I don't use either. In the FRIEND tests, every breath went through a mask, and a test only counted if the respiratory exchange ratio reached 1.00 or higher [1]. That ratio is the lab's sign that the person truly reached their maximum.
Two things before you read it. A percentile is the share of people of your sex and decade who tested below that value, so the 50th is the median, the middle person. And these are measured values. A watch estimate belongs on this table only with the caveats further down.
| Men | 5th | 10th | 25th | 50th | 75th | 90th | 95th |
|---|---|---|---|---|---|---|---|
| 20 to 29 | 29.0 | 32.1 | 40.1 | 48.0 | 55.2 | 61.8 | 66.3 |
| 30 to 39 | 27.2 | 30.2 | 35.9 | 42.4 | 49.2 | 56.5 | 59.8 |
| 40 to 49 | 24.2 | 26.8 | 31.9 | 37.8 | 45.0 | 52.1 | 55.6 |
| 50 to 59 | 20.9 | 22.8 | 27.1 | 32.6 | 39.7 | 45.6 | 50.7 |
| 60 to 69 | 17.4 | 19.8 | 23.7 | 28.2 | 34.5 | 40.3 | 43.0 |
| 70 to 79 | 16.3 | 17.1 | 20.4 | 24.4 | 30.4 | 36.6 | 39.7 |
| Women | 5th | 10th | 25th | 50th | 75th | 90th | 95th |
|---|---|---|---|---|---|---|---|
| 20 to 29 | 21.7 | 23.9 | 30.5 | 37.6 | 44.7 | 51.3 | 56.0 |
| 30 to 39 | 19.0 | 20.9 | 25.3 | 30.2 | 36.1 | 41.4 | 45.8 |
| 40 to 49 | 17.0 | 18.8 | 22.1 | 26.7 | 32.4 | 38.4 | 41.7 |
| 50 to 59 | 16.0 | 17.3 | 19.9 | 23.4 | 27.6 | 32.0 | 35.9 |
| 60 to 69 | 13.4 | 14.6 | 17.2 | 20.0 | 23.8 | 27.0 | 29.4 |
| 70 to 79 | 13.1 | 13.6 | 15.6 | 18.3 | 20.8 | 23.1 | 24.1 |
Look at one row. Among men aged 40 to 49, the 5th percentile is 24.2 and the 95th is 55.6, a 2.3-fold spread inside a single decade of age [1]. For women of the same age the spread runs from 17.0 to 41.7, almost 2.5-fold. The paper also reports arithmetic means, and they sit within 1.4 ml/kg/min of these medians [1]. The middle and the average say the same thing here. Age sets the frame, and what you do inside it, on top of what you were born with, decides where you land.
One update. In 2022 the registry, grown to 22,379 tests from 34 laboratories, republished its standards. The new treadmill values came out 1.5 to 4.6 ml/kg/min lower than the 2015 rows above [2]. The 2022 rows sit behind a paywall I haven't gone through, so I'm giving you the 2015 table and telling you it runs a little generous. If your number sits close to a percentile line, assume you're on the lower side of it.
Is a VO2 max of 30, 40, 45 or 50 good for my age?
Here's the table read for the four numbers people ask me about most. Every placing below is read off the men's and women's rows above, and I recomputed each one by hand [1].
| Your number | Man, 25 | Man, 45 | Man, 55 | Woman, 25 | Woman, 45 | Woman, 55 |
|---|---|---|---|---|---|---|
| 30 | 5th to 10th | 10th to 25th | 25th to 50th | just under the 25th | 50th to 75th | 75th to 90th |
| 40 | just under the 25th | 50th to 75th | just above the 75th | 50th to 75th | 90th to 95th | above the 95th |
| 45 | 25th to 50th | the 75th | 75th to 90th | just above the 75th | above the 95th | above the 95th |
| 50 | 50th to 75th | 75th to 90th | 90th to 95th | 75th to 90th | above the 95th | above the 95th |
So the honest answer to "is 45 good" is a question back: how old are you, and are you a man or a woman? For a man of 25 it's below the median. For a man of 45 it's the 75th percentile. For a woman of 45 it's above the 95th. And a 42 sits just under the median for a man in his thirties, and past the 90th percentile for a man in his sixties. That 45 is also the target we name on our homepage as of September 2026: our own number for clients, not a research finding.
Why percentiles and not words like good or excellent? Because the mortality studies were built on percentiles. The Cleveland Clinic cohort of 122,007 patients grouped people by age- and sex-matched percentile [3]. Low was below the 25th, below average the 25th to 49th, above average the 50th to 74th, high the 75th to 97.6th, and elite above that.
The low group died at about five times the rate of the elite group, an adjusted hazard ratio of 5.04 [3]. A hazard ratio is one group's death rate divided by the other's, after the model adjusts for age, sex and the usual risk factors. The band just below the median, the 25th to 49th, against the band just above it, the 50th to 74th, carried 1.41 [3]. Those are associations in observational data, not proof of cause. I went through that evidence, and its limits, in VO2 max and longevity.
One more thing the bands tell you. In 750,302 US veterans, the lowest risk of death sat at about 14 METs, and risk did not rise again in the extremely fit [4]. One MET is 3.5 ml/kg/min, the standard conversion, so 14 METs is about 49 ml/kg/min.
This is how I talk to clients. On a coaching call on 8 May 2026 I put a target to one of them as a band. I said 43 would get them to the excellent category, and 43 to 45 would make me ecstatic. On another, on 30 March 2026: "I would love to get you to at least the upper 20 percent, ideally the upper 10." Labels are shorthand; the percentile is the fact.
Why is the average VO2 max lower for women?
The reasons are physiological, not effort. A 2026 review in Clinical Endocrinology puts it in one sentence: higher testosterone in men leads to greater muscle mass, hemoglobin, bone size and cardiac output [5]. Hemoglobin carries the oxygen and cardiac output delivers it. Both sit inside the VO2 max equation: how much blood the heart moves each minute, times how much oxygen the muscles pull from it.
Then there's the unit. VO2 max is divided by total body weight. A 2025 review in The Journal of Physiology notes that women on average carry a greater proportion of body fat, which does not contribute to oxygen use [6]. Per kilogram, the number reads lower even when the body is doing comparable work.
Read the two tables side by side and the medians sit about 10 ml/kg/min apart in the twenties. In the registry's own summary, the mean difference between men and women was 27 percent, and men's values ran higher in every decade [1]. The absolute gap narrowed from about 3 METs, roughly 10 ml/kg/min, in the twenties to about 2 METs later in life [1]. Computed from the median rows above, the gap is 10.4 in the twenties, 12.2 in the thirties and 11.1 in the forties. Then 9.2 in the fifties, 8.2 in the sixties and 6.1 in the seventies. So it narrows across the span the registry describes, but decade by decade the widest gap is in the thirties.
The same 2026 review notes the other side. In long exercise below all-out effort, female physiology carries advantages, including burning more fat for fuel and tiring more slowly [5]. The tables are split by sex for a reason. Compare a woman with women of her age, never with the men's rows; her 32 in her forties sits just under the 75th percentile.
How fast does the number fall each decade?
Across the 2015 table the median falls about 10 percent per decade, which is the paper's own figure [1]. Computed step by step from one decade to the next, the drops run nearer 13 percent, because each is measured against a smaller starting number. With 34 laboratories' tests, the 2022 update put the average decline at 13.5 percent per decade on the treadmill, about 4.0 ml/kg/min [2]. On the bike it was 16.4 percent [2]. Those are snapshots of different people at different ages. They can't tell you what happens to one person.
For that you need the same people tested again and again. The Baltimore Longitudinal Study of Aging did exactly that: 375 women and 435 men aged 21 to 87, tested repeatedly over a median of 7.9 years [7]. The decline ran at 3 to 6 percent per decade in the twenties and thirties. It then accelerated to more than 20 percent per decade in the seventies and beyond. Men fell faster than women from the forties on, and being active did not exempt anyone: the decline showed in every activity quartile [7].
The mechanism is in the same paper. The fall in VO2 max (the paper calls it peak VO2) mirrored the fall in oxygen pulse, the oxygen used per heartbeat. Maximal heart rate fell only 4 to 6 percent per decade [7]. In the FRIEND registry the mean maximal heart rate went from 190 beats a minute in men in their twenties to 147 in their seventies [1]. A meta-analysis covering 18,712 people put the ceiling at 208 minus 0.7 times your age, and found the old 220-minus-age rule underestimates it in older adults [8].
So the ceiling drops slowly. What each beat delivers drops fast, and that part is trainable, as the Dallas trial below shows. I went into how breathing fits this picture with Patrick McKeown in the recap on breathing and oxygen delivery.
Your own change counts more than the row
In 579 Finnish men aged 42 to 60, VO2 max was measured twice, eleven years apart. The men were then followed for a median of 13.3 years [9]. The average loss over the eleven years was 5.2 ml/kg/min, and each 1 ml/kg/min a man kept was associated with 9 percent lower all-cause mortality [9]. Holding your row while the table slides down beneath you is itself a result.
And the row can be climbed late. In Dallas, 61 healthy, sedentary adults averaging 53 years old, about half of them women, were randomized [10]. Two years of training raised VO2 max 18 percent, from 29.0 to 34.4 ml/kg/min, while controls drifted from 29.5 to 28.7 [10]. On the men's 50 to 59 row, 29.0 sits between the 25th and 50th percentiles and 34.4 between the 50th and 75th. On the women's 50 to 59 row the same move goes from the 75th-to-90th band to the 90th-to-95th. Two years moved a group of ordinary 53-year-olds up one band of the table.
Treadmill, bike or watch: which VO2 max chart are you reading?
Before you place a number, know how it was produced. In 2017 the same registry published cycle ergometer standards from 4,494 maximal tests, and the medians come out lower [11]. Men in their twenties: 48.0 on the treadmill, 41.9 on the bike. Women: 37.6 against 31.0. Men in their seventies: 24.4 against 19.5. Women: 18.3 against 14.8 [1] [11]. My own reading of why: fewer muscles work on a bike, so peak oxygen use is lower. A bike test read against a treadmill table looks worse than it is.
A watch estimate is a third thing. It never measures a breath; it models your VO2 max from pace and heart rate. Three validation studies of the Apple Watch found it read low against the lab, by 6.07 and 6.25 ml/kg/min on average in two of them [12] [13]. The errors ran 13 to 16 percent [12] [13]. The Series 7 read the least fit too high and the fittest too low [14]. One number matters more than the average error. Of the 35 adults with both a lab test and a watch estimate, the Series 10 put 5, 14 percent, in the correct band [12].
Six ml/kg/min is more than a decade of median decline on the men's rows above, and close to two on the women's rows from the thirties on. So the band your watch shows is not a placing. It's an estimate of a placing, and in that study it was right one time in seven. Use the watch for direction over months on one wrist, and a lab test, with a mask, for the row.
Garmin and WHOOP estimates are their own story, and I went through them in the longevity article's wearable section. On 26 May 2026 a client's wearable reported a maximum heart rate above what his lab test had measured. I set his training zones from the lab's number, not the wrist's.
What I do with a client's number
Four things, in order.
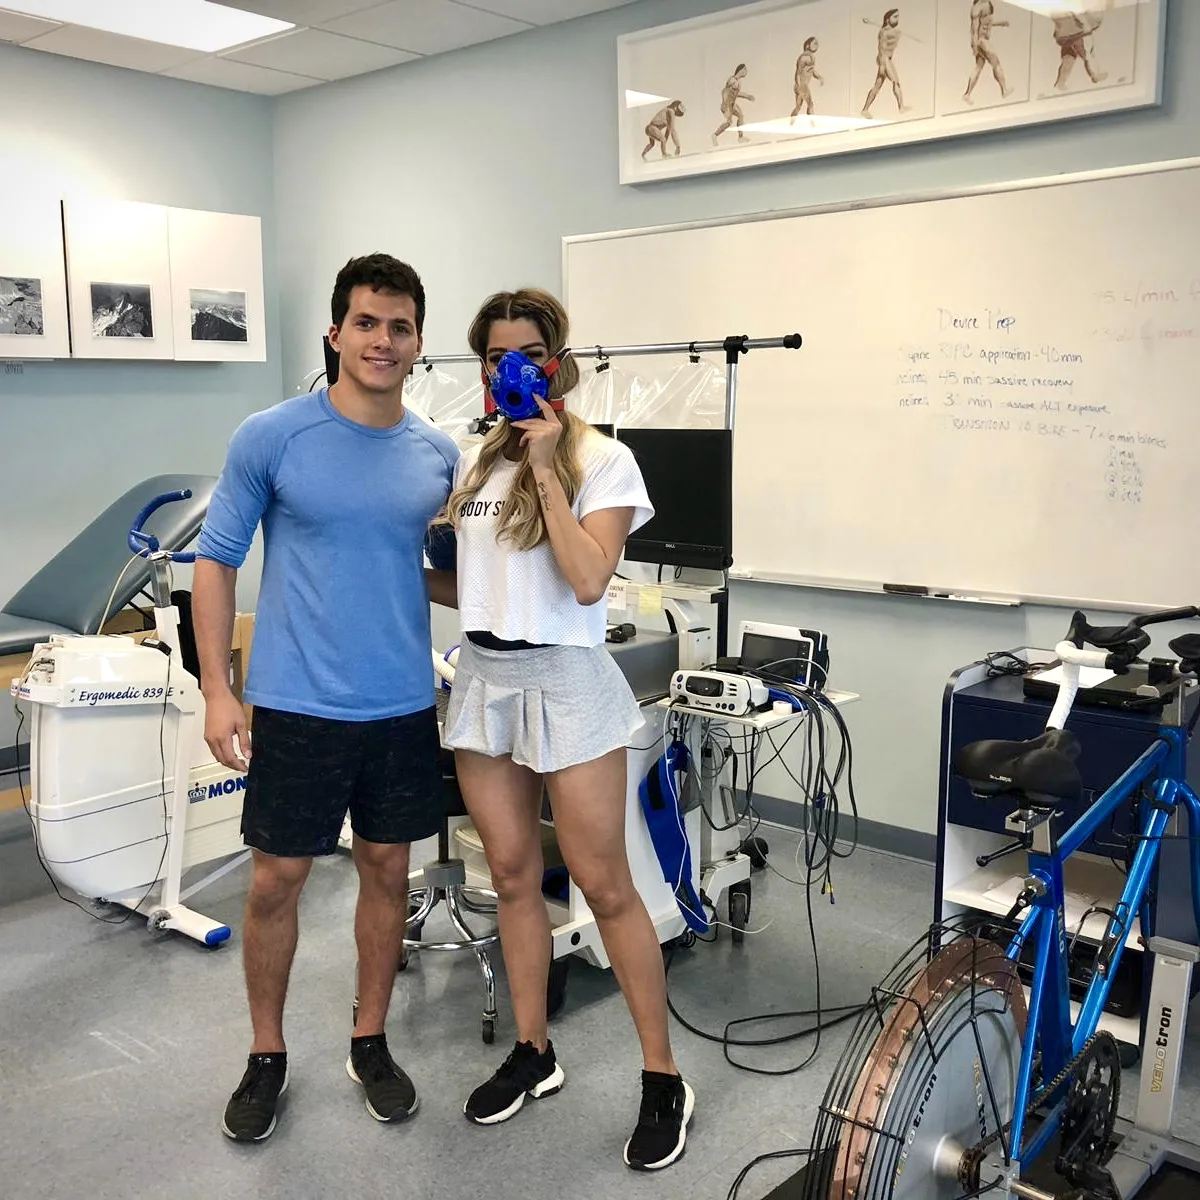
First, I match the method. A watch number, a bike test and a treadmill test are three different rulers, and I don't mix them. On 31 August 2026 a client's wearable showed a jump in one month that was too big to take at face value. My reaction, on the call, was that I wasn't sure I believed it. A jump on one ruler gets confirmed on the ruler that measures breath.
Second, I find the row, not the label. Excellent, good and fair are a chart author's words; the percentile is the data. When a client's number sits between two lines, I tell them which two, and what the next line up would take.
Third, I set the target by age. To a 31-year-old I spoke with on 2 June 2026: "I would love to help you get your VO2 max to 50 at least." On his row, 50 sits between the 75th and 90th percentiles. For a man of 55, that same 50 would sit near the 95th, and I'd set it differently.
Fourth, I watch what moves with it. With my clients, resting heart rate and the HRV trend move with it. That's what I see on the dashboards, not a study finding. The lever, a heart that moves more blood per beat, and how a busy adult trains it, are in the longevity article. This one is about reading the number. And it's completely bio-individual. The percentile tells you where you stand among people your age and sex. It doesn't tell you what your body will do with a given week of training.
VO2 max by age: how to place your own number this week
- Write down the number and how it was made: a lab treadmill test, a lab bike test, or a watch estimate. Only the first belongs on the tables above without a caveat [1] [11].
- Find your sex and your decade. Read the percentile band your number falls in, not the word a chart gives it.
- If you're close to a line, assume the lower band. The 2022 standards run 1.5 to 4.6 ml/kg/min below this table [2].
- If your only number is a watch, treat it as an estimate that landed in the right band one time in seven [12]. Get one lab test for the row.
- Note the two lines that mattered most in the mortality cohorts: the 25th, below which the low-fitness group sat, and the 50th [3].
- Retest on the same ruler, and compare the change against your own earlier number rather than the table. Each 1 ml/kg/min held was associated with lower risk in the Finnish men [9].
- Remember it's bio-individual. The row is where you are among your peers, and the plan is yours.
This is not medical advice. A maximal exercise test is done in a lab, and cleared by your physician first where your history calls for it. I'm a physiologist, not a doctor, and every number here is read against your own baseline over time.
Quick answers
What is a good VO2 max for my age?
Good means above the median for your sex and decade; the top quarter starts at the 75th percentile. Those percentiles come from the FRIEND registry: 7,783 measured treadmill tests, every one read from a mask, not a watch [1]. No estimates. Men's medians run 48.0, 42.4, 37.8, 32.6, 28.2 and 24.4 ml/kg/min from the twenties to the seventies [1]. The women's run 37.6, 30.2, 26.7, 23.4, 20.0 and 18.3 over the same decades [1]. The 75th percentile for a man in his forties is 45.0; for a woman, 32.4. A 2022 update of the same registry came out 1.5 to 4.6 ml/kg/min lower [2]. If your number sits close to a line, read it into the lower band.
What is the average VO2 max by age for men and women?
Measured medians by decade: 48.0, 42.4, 37.8, 32.6, 28.2 and 24.4 ml/kg/min for men, from 7,783 maximal treadmill tests [1]. For women they are 37.6, 30.2, 26.7, 23.4, 20.0 and 18.3 [1]. The paper's arithmetic means sit within 1.4 ml/kg/min of these medians [1]. Across the table the median falls about 10 percent per decade [1]. On the treadmill, the 2022 update of the same registry came out 1.5 to 4.6 ml/kg/min lower [2]. Cycle ergometer medians run lower than treadmill medians at the ages the registry compared [11]. That is the middle of the pack. Not a target.
What does a VO2 max chart by age show?
It lines up your decade of life and your sex, then shows where a measured number falls among people who match both [1]. Men's rows run from a median of 48.0 ml/kg/min in the twenties to 24.4 in the seventies [1]. The women's run from 37.6 to 18.3, from the same 7,783 maximal treadmill tests [1]. I read a chart in one direction: find your row by sex and decade, then your column by percentile. Never compare a man's row to a woman's. A cycle ergometer chart reads lower than a treadmill chart [11], and a watch estimate is not a chart placing at all [12]. Match the ruler before you read the row.
Is a VO2 max of 45 good?
It depends on your age and sex. On the FRIEND table, 45 sits between the 25th and 50th percentiles for a man of 25, and at the 75th for a man of 45 [1]. For a man of 55 it sits between the 75th and 90th, and for a woman of 45 or older above the 95th [1]. I place the number by decade and sex before I call it anything. A 45 that's ordinary for one person is near the top for another. If you're close to a percentile line, assume you sit on the lower side of it. The 2022 update of this registry read 1.5 to 4.6 ml/kg/min lower [2].
What is a good VO2 max by age for a man?
Read his decade's row. At the 75th percentile, the top quarter, a man's measured VO2 max runs 55.2, 49.2, 45.0, 39.7, 34.5 and 30.4 ml/kg/min from the twenties to the seventies [1]. Medians sit 6 to 7 ml/kg/min below those, in the table above [1]. In 750,302 US veterans, the lowest risk of death sat at about 14 METs, which is about 49 ml/kg/min, with no sign of added risk above it [4].
What is a good VO2 max by age for a woman?
Read the women's rows, never the men's. Women's medians run from 37.6 ml/kg/min in the twenties to 18.3 in the seventies, and the 75th percentile from 44.7 to 20.8 [1]. A woman of 45 with a 32 sits just under her 75th percentile, above about three in four women her age [1]. The gap with men isn't effort. Men have more hemoglobin and a larger cardiac output, both terms in the VO2 max equation [5]. And the per-kilogram unit reads lower for a higher share of body fat [6]. Computed from the medians, the gap runs as wide as 12.2 ml/kg/min in the thirties and narrows to 6.1 in the seventies.
Can I place my Apple Watch VO2 max on this chart?
Only as an estimate, never as your row. Against lab tests the watch read low by about 6 ml/kg/min, more than a decade of median decline on the table [12] [13]. Of the 35 adults it analysed, the watch put 5 of them, 14 percent, in the correct band [12]. A study of the Series 7 found the watch read the least fit too high and the fittest too low [14]. I use a watch for the trend on one wrist over months, and a lab test with a mask for the row. Treat the band a watch shows as a guess, not a placing.
How much does VO2 max drop per decade?
Across people of different ages, about 10 percent per decade in the 2015 FRIEND registry [1]. Its 2022 update, built from 34 laboratories, found 13.5 percent per decade on the treadmill, about 4.0 ml/kg/min [2]. In the same people followed over time, the Baltimore Longitudinal Study of Aging found a different pattern [7]. The fall ran 3 to 6 percent per decade in the twenties and thirties, then more than 20 percent in the seventies [7]. Maximal heart rate fell only 4 to 6 percent per decade in that study; the oxygen used per heartbeat fell with the VO2 max [7]. Holding your own number against that clock is itself a result: each point a Finnish man kept over eleven years was associated with 9 percent lower mortality [9].
If you'd rather have your VO2 max read against your own baseline than against an age chart, that's what the assessment is for. Dr. Joel reads your numbers with you, and a lab VO2 max test can be added to it. And I went deeper on why this one number matters for how long you live with Jeroen Molinger on episode 68 of the podcast. Discover your science. Optimize your life.
Supporting Evidence
- Kaminsky, L. A., Arena, R., & Myers, J. (2015). Reference standards for cardiorespiratory fitness measured with cardiopulmonary exercise testing: data from the Fitness Registry and the Importance of Exercise National Database. Mayo Clinic Proceedings, 90(11), 1515-1523. Read 30 September 2026. doi:10.1016/j.mayocp.2015.07.026
- Kaminsky, L. A., Arena, R., Myers, J., Peterman, J. E., Bonikowske, A. R., Harber, M. P., Medina Inojosa, J. R., Lavie, C. J., & Squires, R. W. (2022). Updated reference standards for cardiorespiratory fitness measured with cardiopulmonary exercise testing: data from the Fitness Registry and the Importance of Exercise National Database (FRIEND). Mayo Clinic Proceedings, 97(2), 285-293. Read 30 September 2026. doi:10.1016/j.mayocp.2021.08.020
- Mandsager, K., Harb, S., Cremer, P., Phelan, D., Nissen, S. E., & Jaber, W. (2018). Association of cardiorespiratory fitness with long-term mortality among adults undergoing exercise treadmill testing. JAMA Network Open, 1(6), e183605. Read 30 September 2026. doi:10.1001/jamanetworkopen.2018.3605
- Kokkinos, P., Faselis, C., Samuel, I. B. H., Pittaras, A., Doumas, M., Murphy, R., Heimall, M. S., Sui, X., Zhang, J., & Myers, J. (2022). Cardiorespiratory fitness and mortality risk across the spectra of age, race, and sex. Journal of the American College of Cardiology, 80(6), 598-609. Read 30 September 2026. doi:10.1016/j.jacc.2022.05.031
- Holdsworth, D. A., O'Leary, T. J., Doig, C. L., Taylor, N., Dosanjh, J., Woods, D. R., Stacey, M. J., & Gifford, R. M. (2026). Physiological basis of sex differences in human performance and exercise-associated pathology. Clinical Endocrinology, 105(2), 151-162. Read 30 September 2026. doi:10.1111/cen.70150
- Tripp, T. R., Kontro, H., Gillen, J. B., & MacInnis, M. J. (2025). Fit for comparison: controlling for cardiorespiratory fitness in exercise physiology studies of sex as a biological variable. The Journal of Physiology, 603(8), 2219-2230. Read 30 September 2026. doi:10.1113/JP287735
- Fleg, J. L., Morrell, C. H., Bos, A. G., Brant, L. J., Talbot, L. A., Wright, J. G., & Lakatta, E. G. (2005). Accelerated longitudinal decline of aerobic capacity in healthy older adults. Circulation, 112(5), 674-682. Read 30 September 2026. doi:10.1161/CIRCULATIONAHA.105.545459
- Tanaka, H., Monahan, K. D., & Seals, D. R. (2001). Age-predicted maximal heart rate revisited. Journal of the American College of Cardiology, 37(1), 153-156. Read 30 September 2026. doi:10.1016/s0735-1097(00)01054-8
- Laukkanen, J. A., Zaccardi, F., Khan, H., Kurl, S., Jae, S. Y., & Rauramaa, R. (2016). Long-term change in cardiorespiratory fitness and all-cause mortality: a population-based follow-up study. Mayo Clinic Proceedings, 91(9), 1183-1188. Read 30 September 2026. doi:10.1016/j.mayocp.2016.05.014
- Howden, E. J., Sarma, S., Lawley, J. S., Opondo, M., Cornwell, W., Stoller, D., Urey, M. A., Adams-Huet, B., & Levine, B. D. (2018). Reversing the cardiac effects of sedentary aging in middle age: a randomized controlled trial. Circulation, 137(15), 1549-1560. Read 30 September 2026. doi:10.1161/CIRCULATIONAHA.117.030617
- Kaminsky, L. A., Imboden, M. T., Arena, R., & Myers, J. (2017). Reference standards for cardiorespiratory fitness measured with cardiopulmonary exercise testing using cycle ergometry: data from the Fitness Registry and the Importance of Exercise National Database (FRIEND) Registry. Mayo Clinic Proceedings, 92(2), 228-233. Read 30 September 2026. doi:10.1016/j.mayocp.2016.10.003
- Lambe, R., Schumann, M., Donnelly, L., Hamilton, S., Lally, S., Rafter, E., O'Reilly, S., White, T., & Doherty, C. (2026). Accuracy of VO2 max estimates from Apple Watch Series 10. Mayo Clinic Proceedings: Digital Health, 4(2), 100357. Read 30 September 2026. doi:10.1016/j.mcpdig.2026.100357
- Lambe, R., O'Grady, B., Baldwin, M., & Doherty, C. (2025). Investigating the accuracy of Apple Watch VO2 max measurements: a validation study. PLoS One, 20(5), e0323741. Read 30 September 2026. doi:10.1371/journal.pone.0323741
- Caserman, P., Yum, S., Göbel, S., Reif, A., & Matura, S. (2024). Assessing the accuracy of smartwatch-based estimation of maximum oxygen uptake using the Apple Watch Series 7: validation study. JMIR Biomedical Engineering, 9, e59459. Read 30 September 2026. doi:10.2196/59459